About REV UP
The REV UP Voting Campaign builds the power of the disability vote through a national network of coalitions and organizations.
Building the Power of the Disability Vote
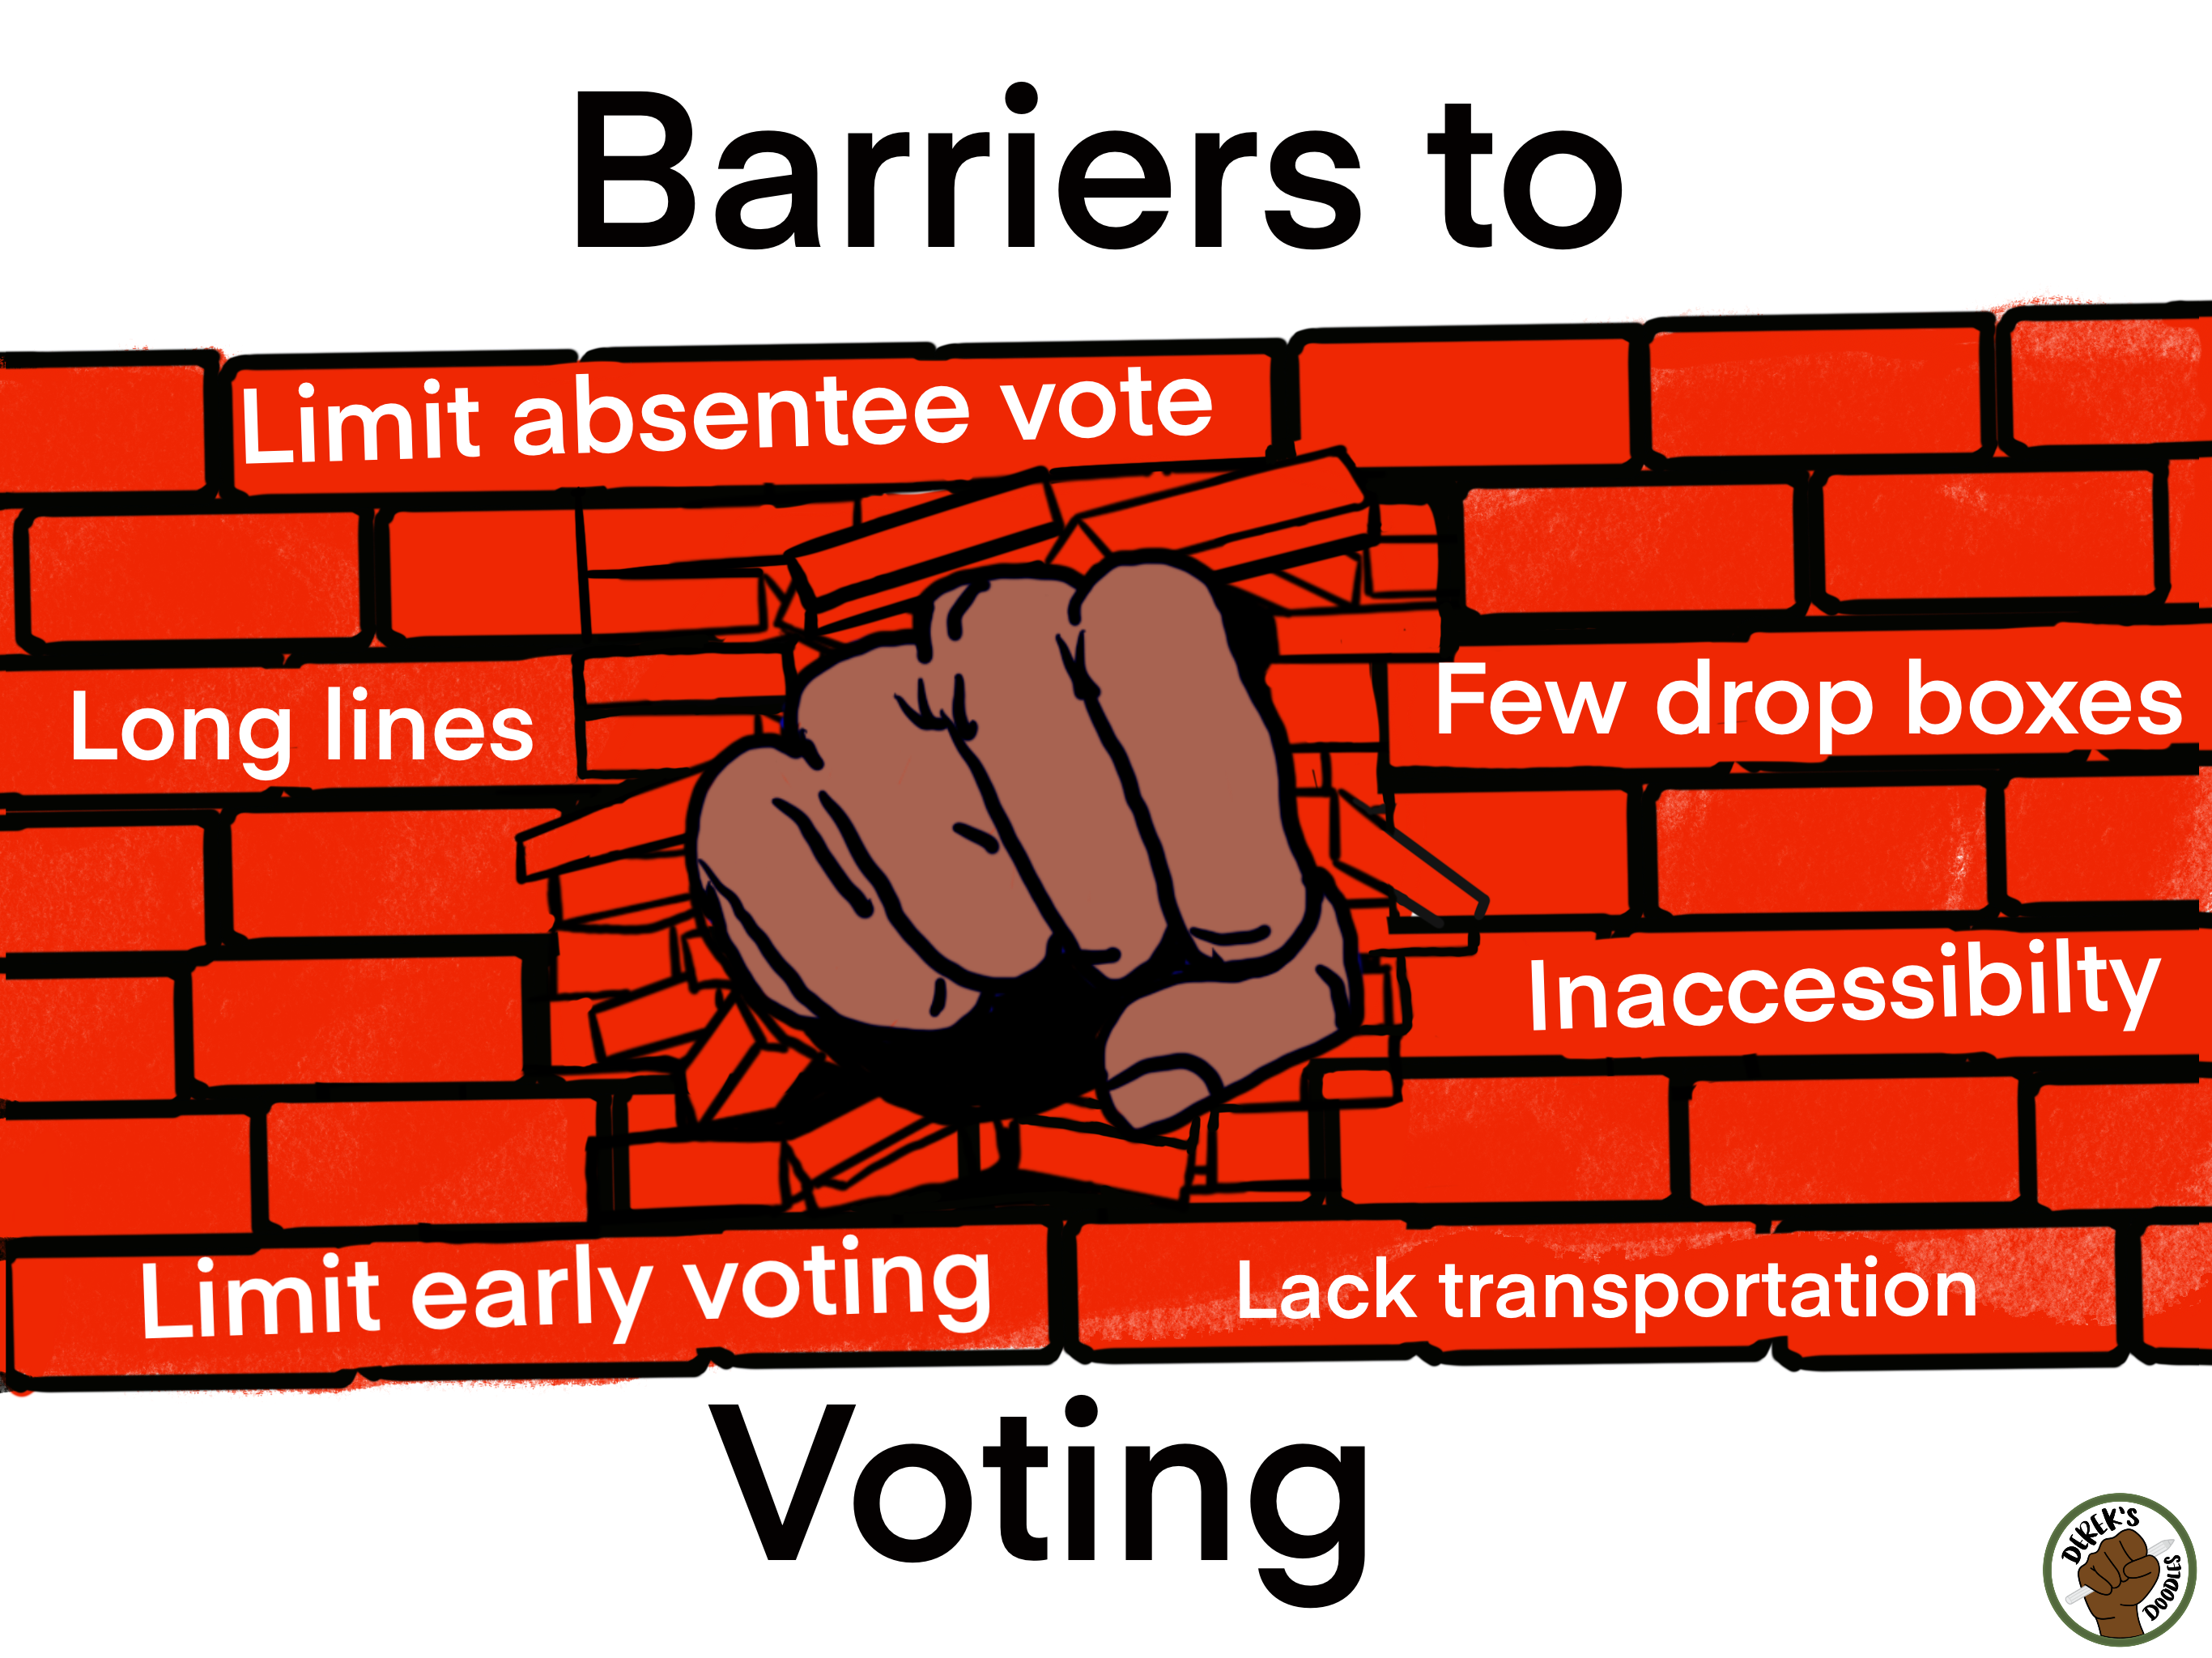
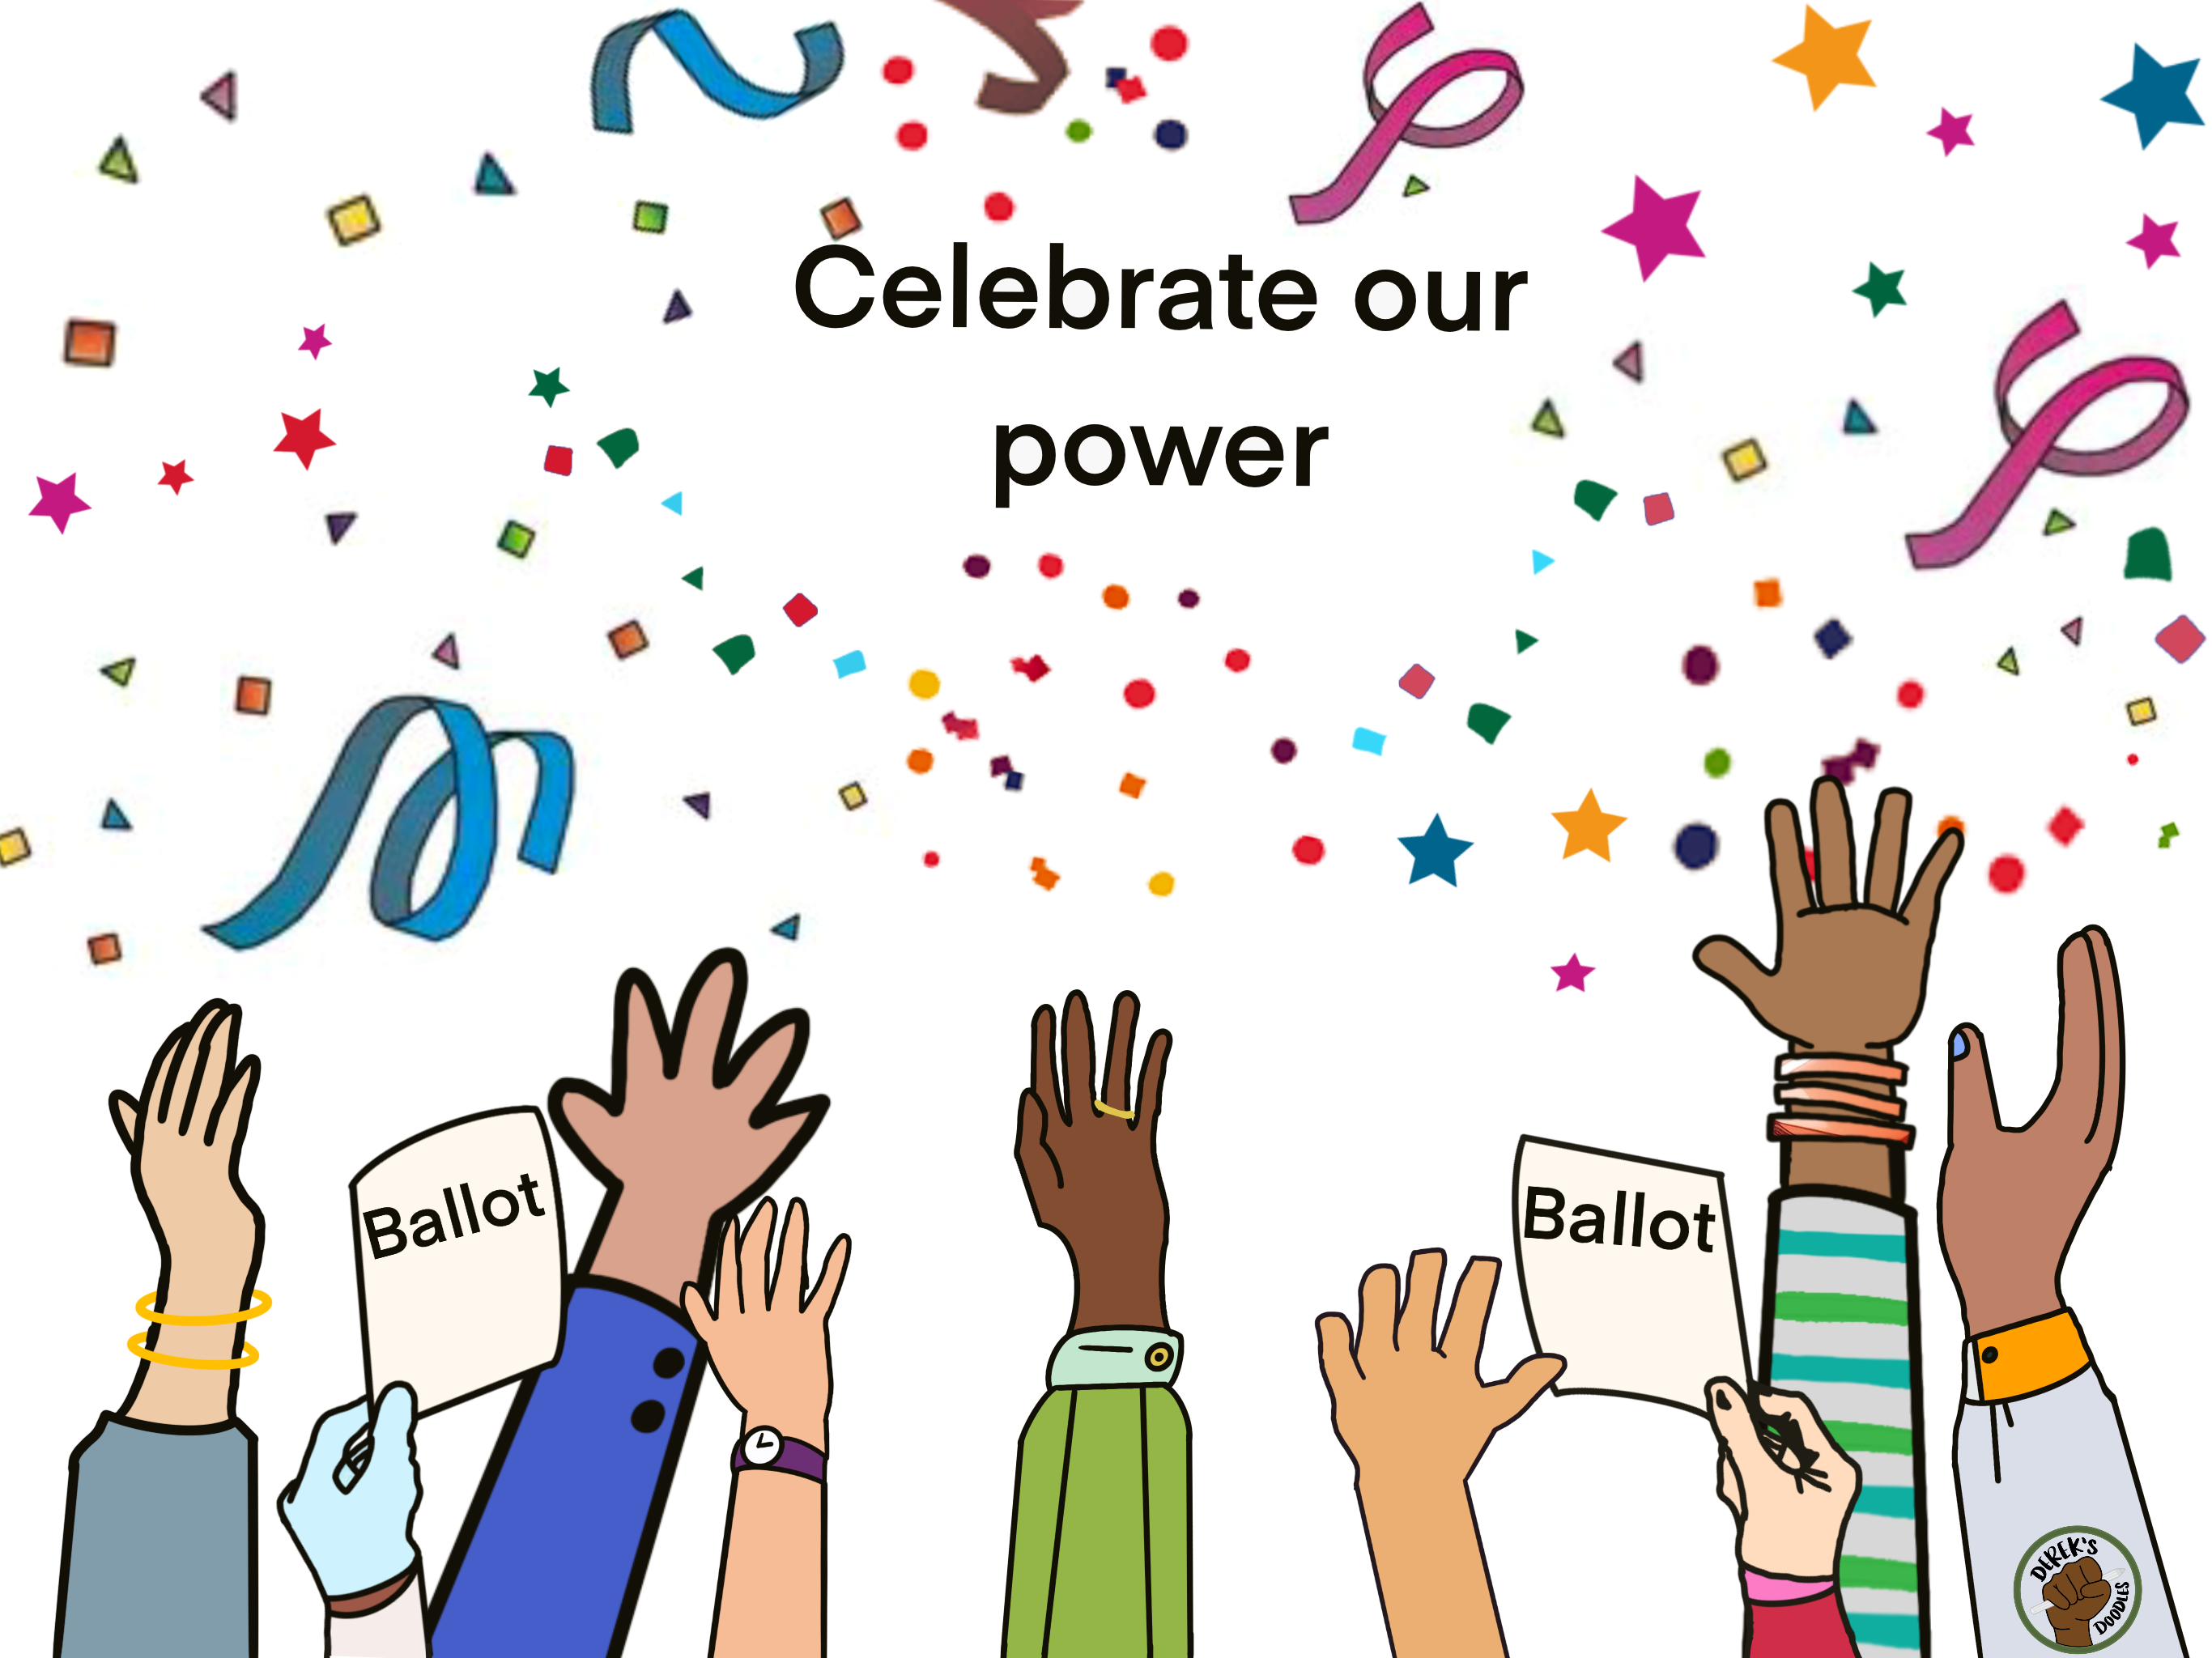
REV UP’s mission is to build the power of the disability vote through increasing civic engagement in the disability community and improving the accessibility of elections. REV UP stands for “Register, Educate, Vote, Use your Power!” Learn about REV UP’s 2024 Goals.
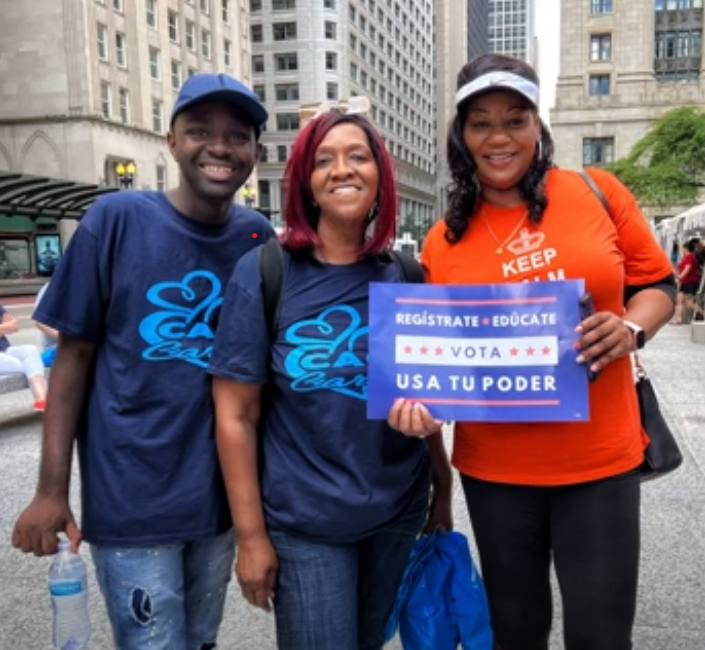
Grassroots, Local Leaders
Although REV UP is a national movement, we believe change happens at the local level. We also believe in the power of grassroots organizing. REV UP has coalitions in twenty states and partners across the country. Meet our state coalitions.
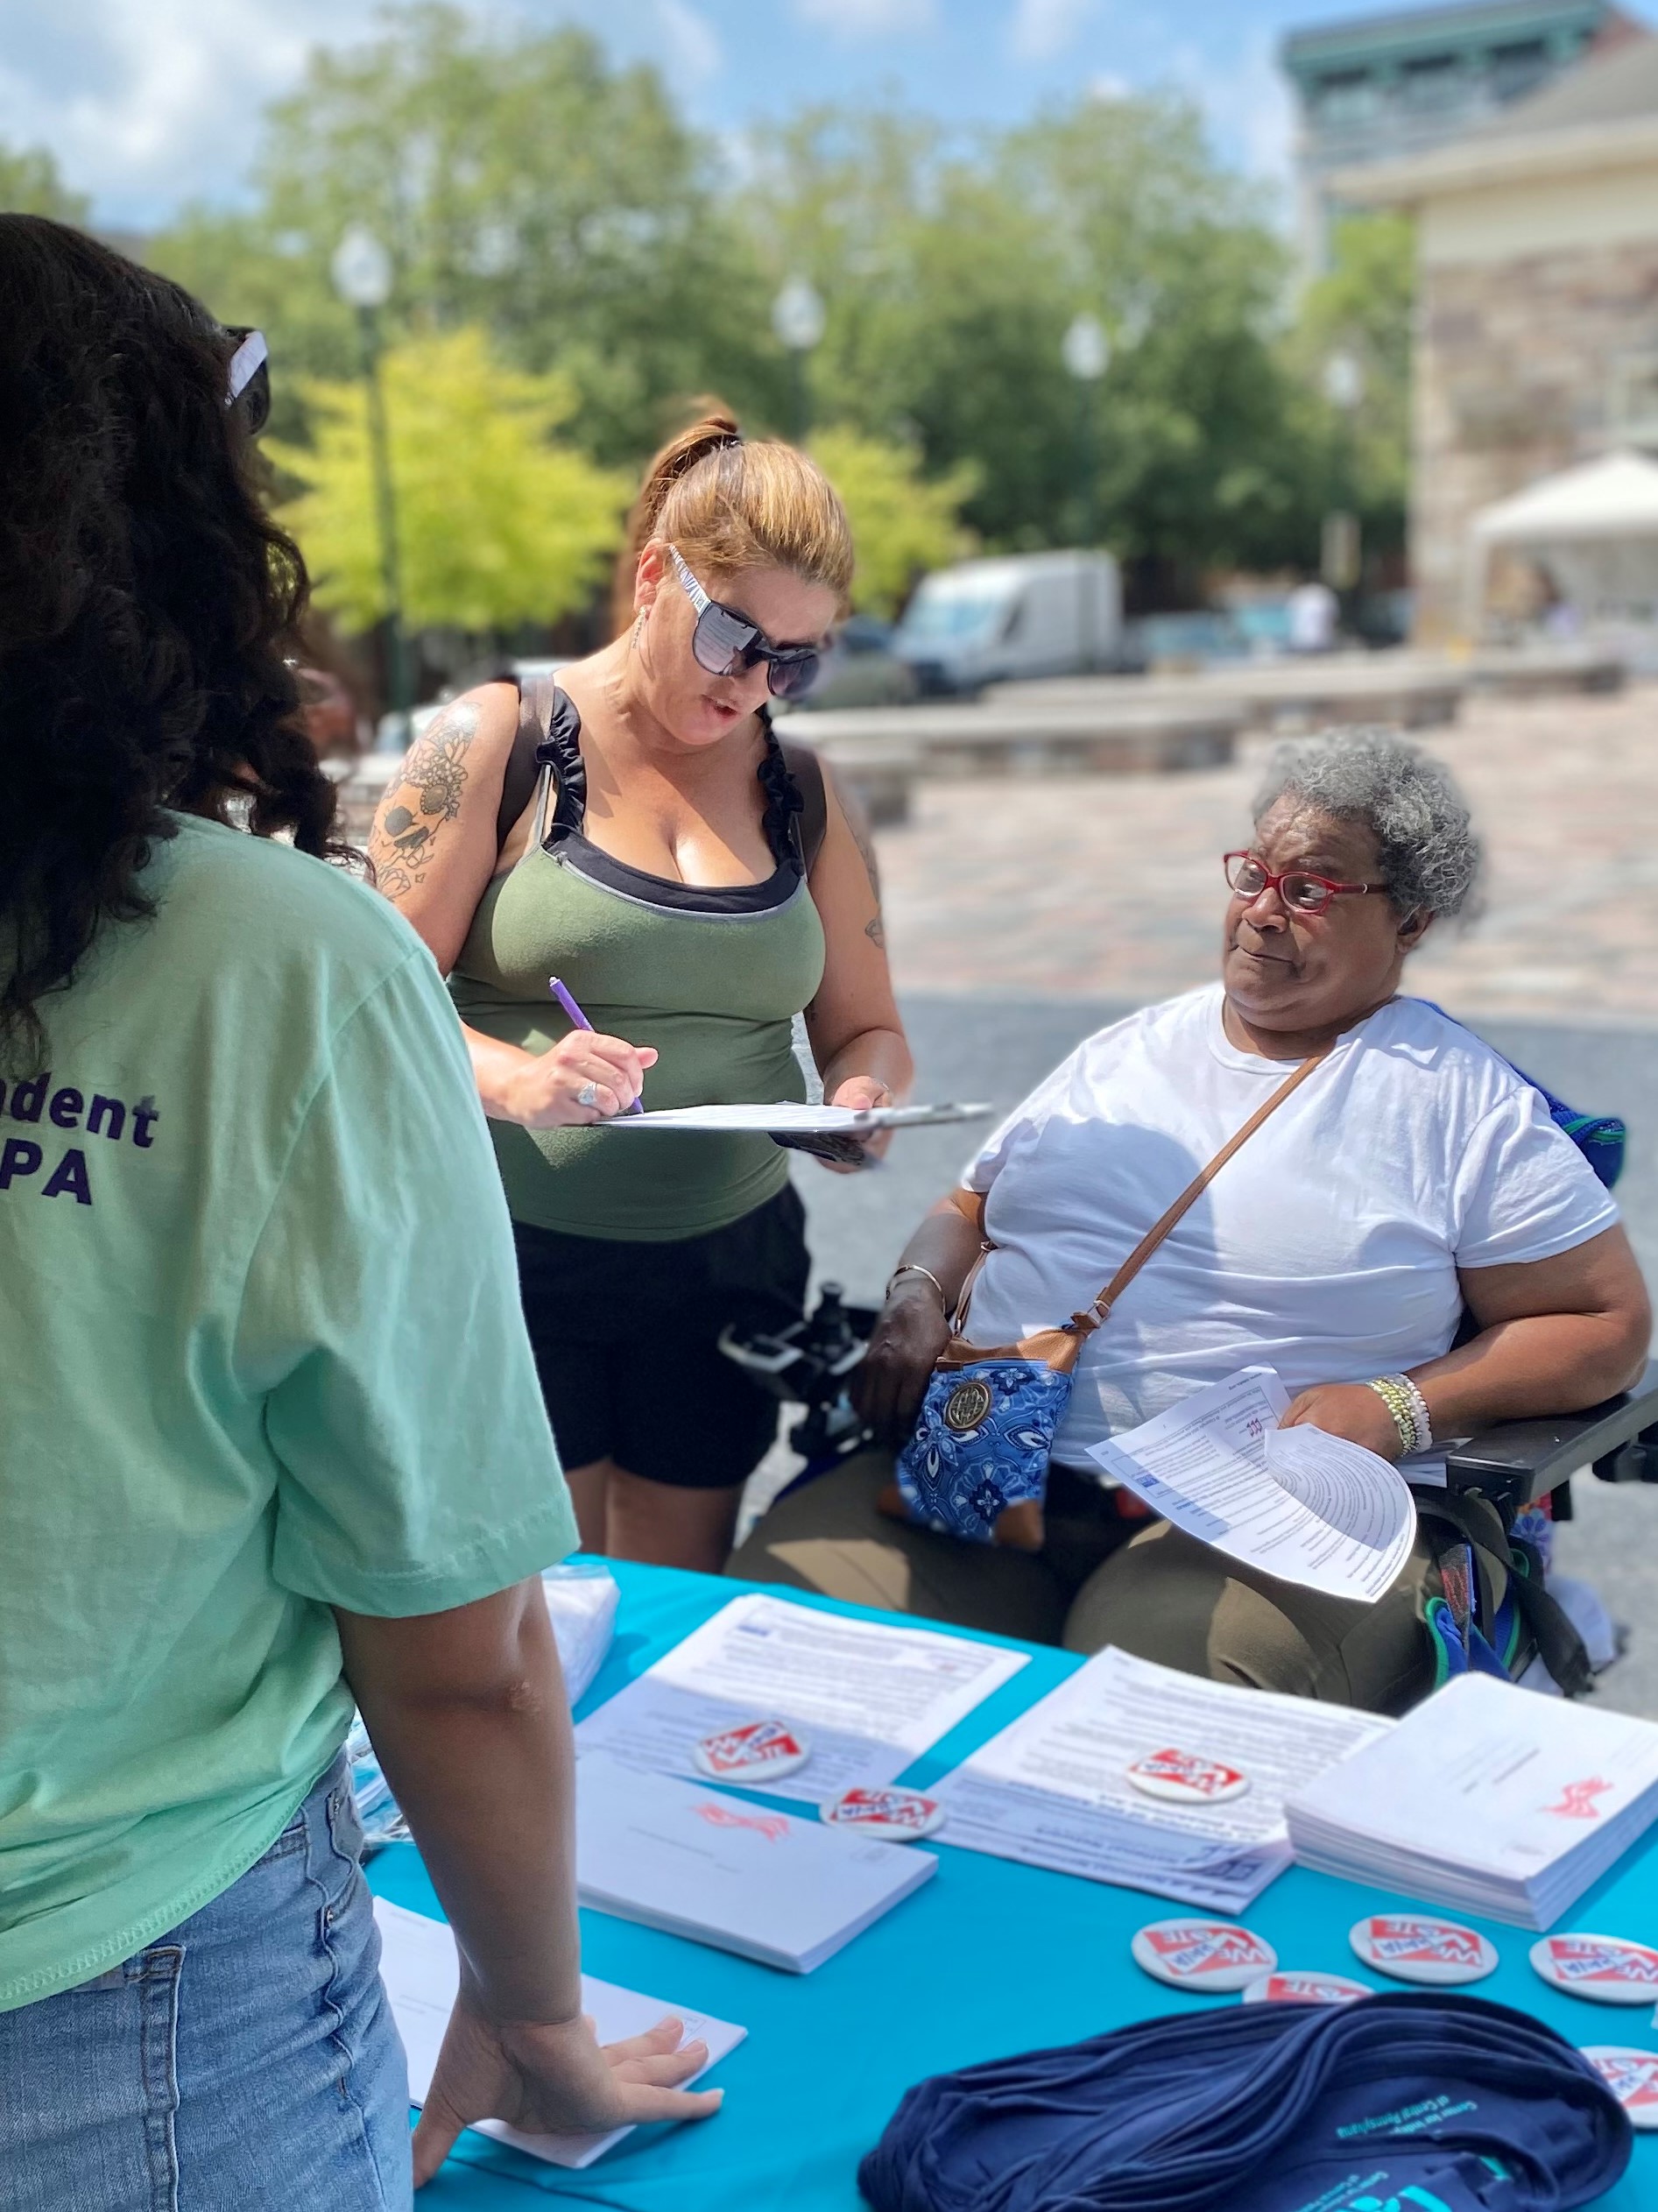

Advocacy Takes Many Forms
There are so many ways to participate in advocacy, including through art, music, and more!
Join the REV UP Movement
- Sign up for our REV UPdates newsletter.
- National Calls or Round Tables
- Join a local REV UP coalition!
- Join us in celebrating Disability Voting Rights Week, the second week of September!
Don’t see a coalition in your area?
- Start your own coalition!
- Check out our REV UP Campaign guide. Then, schedule an introductory call with our REV UP Coalitions Coordinator. Note: You cannot use the REV UP logo or name without meeting with our team and signing our Community Guidelines.
- Check out our resources – You don’t have to join a coalition to get involved in REV UP. Check out our resources for how you as an organization or individual can get connected to disability voting rights work.